Which colleges in America help the most children climb the income ladder?

We take a step toward answering this question by constructing mobility report cards – statistics on students’ earnings and their parents’ incomes – for each college in America.

Mobility Report Cards for Columbia and SUNY-Stony Brook

College Figure 1
Click for more details on figure
Bars show estimates of the fraction of parents who come from each quintile of the income distribution. Lines show estimates of the fraction of students from each of those quintiles who reach top fifth as adults.

Access to colleges varies substantially across the income distribution. At Ivy League colleges such as Columbia University, shown in the chart above, more students come from families in the top 1% of the income distribution than the bottom half of the income distribution.

Children from low-income families have nearly the same odds of reaching the top fifth of the income distribution as their peers from higher-income families at selective colleges, indicating that children from low-income backgrounds admitted to selective colleges are not over-placed at these schools.

Some colleges, such as SUNY-Stony Brook, have a much larger fraction of children from low-income families yet have earnings outcomes that are nearly comparable to those at highly selective colleges such as Columbia. These colleges have very high mobility rates — they have large numbers of students who come from poor families and end up with high incomes.

Top Colleges by Mobility Rate

Rank Name Mobility Rate Access Success Rate
Cal State University - LA9.9%33.1%29.9%
Pace University - New York8.4%15.2%55.6%
SUNY - Stony Brook8.4%16.4%51.2%
Technical Career Institutes8.0%40.3%19.8%
University of Texas - Pan American7.6%38.7%19.8%
City Univ. of New York System7.2%28.7%25.2%
Glendale Community College7.1%32.4%21.9%
South Texas College6.9%52.4%13.2%
Cal State Polytechnic - Pomona6.8%14.9%45.8%
University of Texas - El Paso6.8%28.0%24.4%

Click for more details on table
This table shows the ten colleges with the highest level of bottom-to-top-quintile mobility rates among colleges with 300 or more students per cohort.

We define a college’s mobility rate as the fraction of its students who come from a family in the bottom fifth of the income distribution and end up in the top fifth of the income distribution. Each college’s mobility rate is the product of access, the fraction of its students who come from families in the bottom fifth, and its success rate, the fraction of such students who reach the top fifth. The colleges that have the highest upward mobility rates, listed in the table above, are typically mid-tier public schools that have both large numbers of low-income students and very good outcomes.

Trends in Low-Income Access from 2000-2011

Selected Colleges
College Figure 3

Click for more details on figure
This figure plots the fraction of students whose parents are in the bottom quintile of the household income distribution at selected colleges.

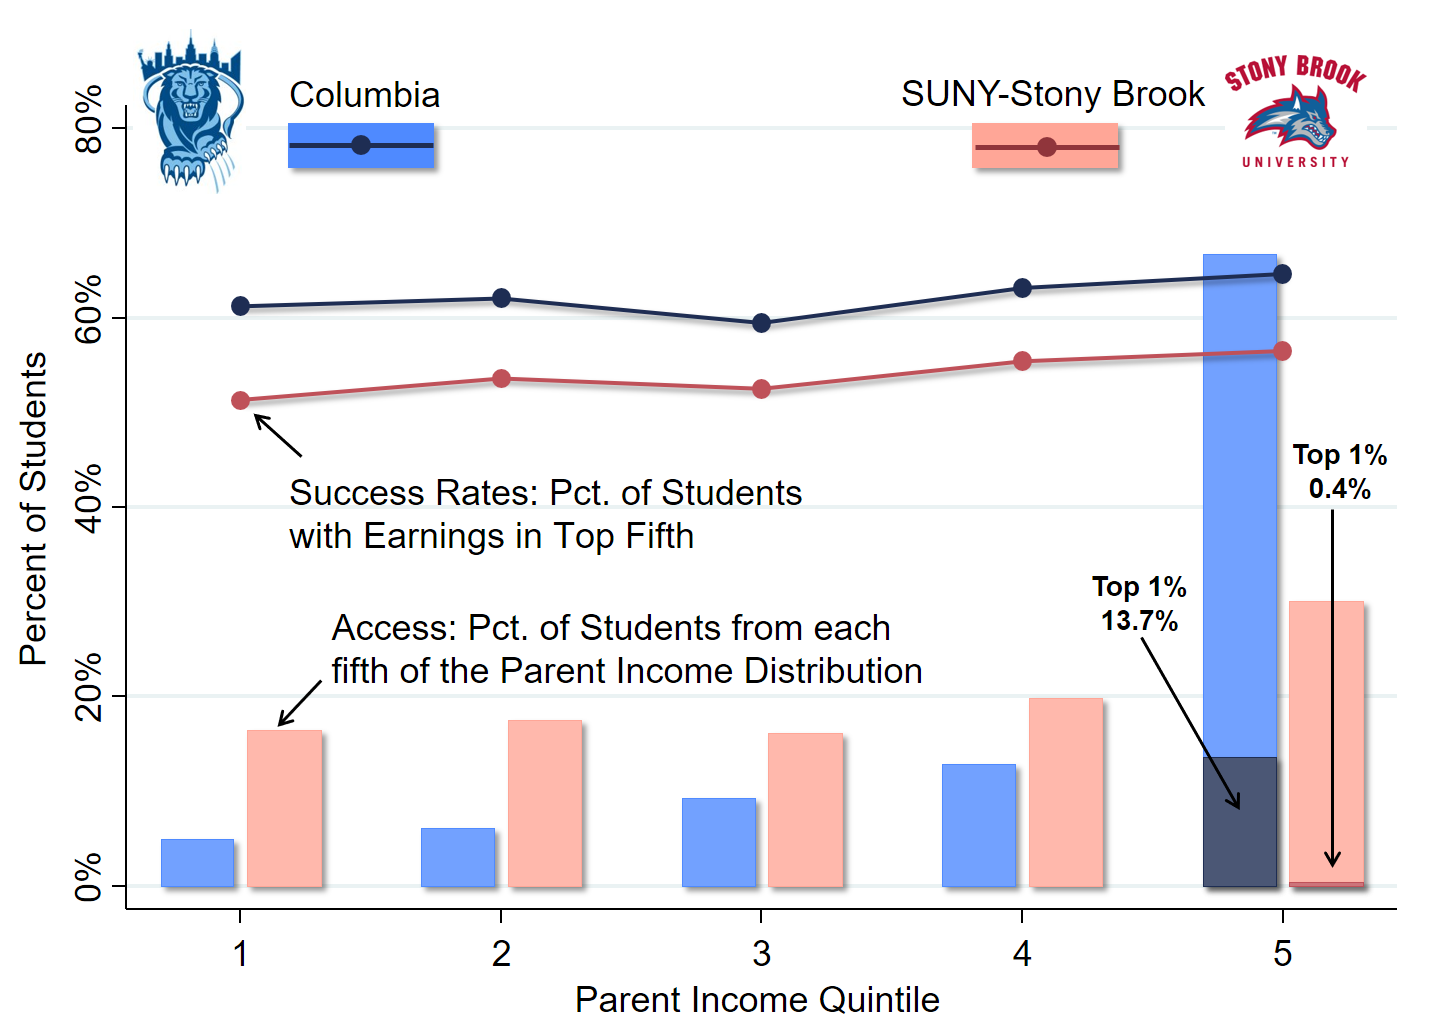
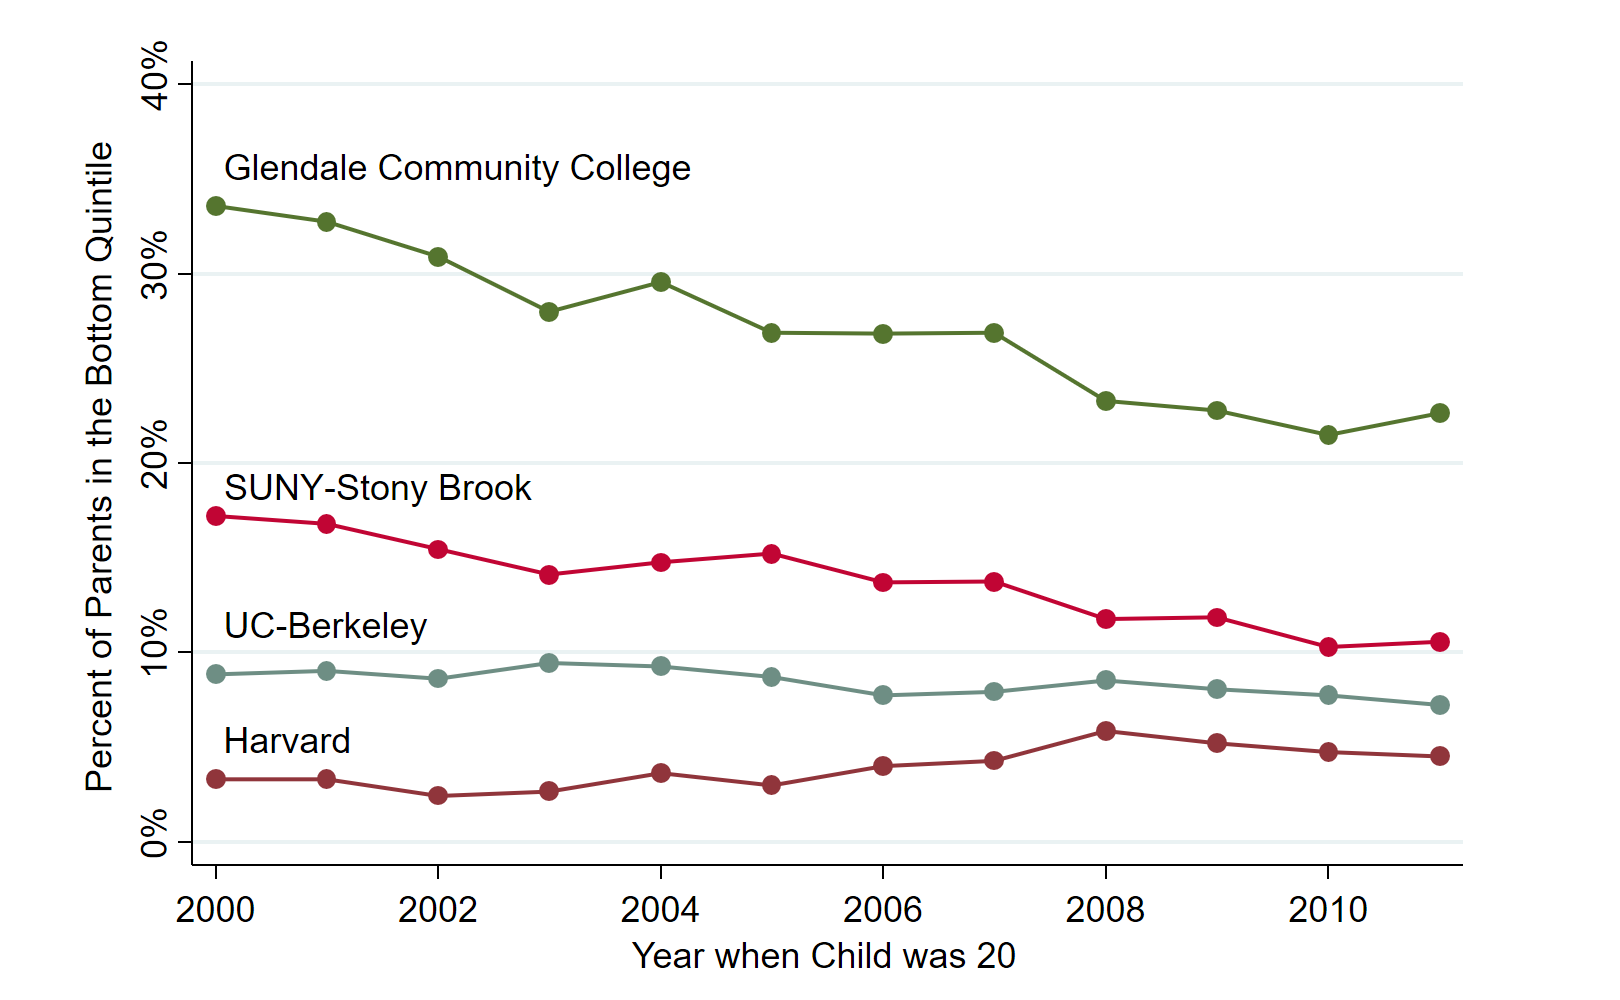
The fraction of students from low-income families at the Ivy-Plus colleges increased very little over the period 2000-2011. Meanwhile, access at institutions with the highest mobility rates (e.g., SUNY-Stony Brook and Glendale in the figure above) fell sharply over the 2000s. Thus, the colleges that may have offered many low-income students pathways to success are becoming less accessible to them.

These trends in access call for a reassessment of policies at the federal, state, and college levels. The statistics constructed here give researchers and policymakers data to develop and test new policy solutions.

To learn more, please see our fact sheet, non-technical summary, paper, or slides; download the data; or explore the data for each college with this interactive tool created by the New York Times.

The U.S. Department of the Treasury has released a blog post comparing our mobility report cards with the Department of Education's College Scorecards.